
Mean, median, mode and range for kids
Mean, median, mode and range are four ways to describe a set of numbers: three find a typical value, and the range shows the spread.
This page explains each one with a worked example and a dot plot, has a calculator that shows its working, and links statistics and probability worksheets.
What kids learn about statistics, grade by grade
- Grades 2–5: picture graphs, bar graphs and line plots: collecting data and reading it.
- Grade 6 (6.SP.A.1 to 6.SP.B.5): statistical questions, mean, median, mode and range, dot plots, histograms and box plots.
- Grade 7 (7.SP): comparing two groups using their centers and spreads, and probability.
- Grade 8 (8.SP): scatter plots, lines of best fit and two-way tables.
Where to start with mean, median, mode and range
With data your child cares about: how many minutes each family member read today, goals scored in each game, or the heights of the family. Real numbers make “typical” mean something.
Keep the first data sets small, with five to seven values, so your child can sort them in their head. Move on to bigger lists, decimals and graphs once the four measures feel easy. A calculator is fine for adding long lists, but finding the median and mode should stay a thinking job.
The big idea
A list of numbers is hard to take in at a glance. These four measures each sum it up in one number. Take the data 4, 8, 6, 5, 8, 3, 9: the number of books seven friends read this month.
Mean, median, mode and range, explained
Mean: the average
Add all the values and divide by how many there are. 4 + 8 + 6 + 5 + 8 + 3 + 9 = 43, and 43 ÷ 7 ≈ 6.14. The mean is what everyone would have if the books were shared out equally.
Median: the middle
Put the values in order: 3, 4, 5, 6, 8, 8, 9. The middle one is 6. With an even number of values, take the halfway point between the two middle ones.
Mode: the most common
The value that appears most often: 8, which appears twice. A set can have no mode or more than one.
Range: the spread
Biggest minus smallest: 9 − 3 = 6. A big range means the values are spread out; a small range means they are close together.
A rhyme many teachers use: “Hey diddle diddle, the median’s the middle, you add then divide for the mean. The mode is the one that appears the most, and the range is the difference between.”
Mean, median, mode and range calculator
Type any numbers. You’ll see them in order and each measure with its working.
Mean or median: which one to use
Use the median when a few values are much bigger or smaller than the rest. If six children have $5 pocket money and one has $100, the mean is about $18.57, which describes nobody. The median, $5, is far more typical.
Use the mean when the values are fairly even, and the mode for things that aren’t numbers, like the most popular ice cream flavor.
Statistical questions
Grade 6 starts with the question, not the numbers (6.SP.A.1). A statistical question expects answers that vary.
“How tall am I?” has one answer. “How tall are the children in my class?” has many, so it is statistical.
Ask your child to sort a few questions: “How many pets does our family have?” (not statistical) and “How many pets do families on our street have?” (statistical). Spotting the difference is a grade 6 skill in its own right.
A worked example with an even number of values
Six friends scored 7, 3, 9, 4, 10 and 9 on a spelling test. In order: 3, 4, 7, 9, 9, 10.
- Mean: 3 + 4 + 7 + 9 + 9 + 10 = 42, and 42 ÷ 6 = 7.
- Median: the two middle values are 7 and 9, so the median is halfway between: 8.
- Mode: 9 appears twice, so the mode is 9.
- Range: 10 − 3 = 7.
Here the mean, median and mode are all different. That is normal, and it is a good reason to ask which one best answers the question.
Outliers and the mean
An outlier is a value far from the others. One outlier can pull the mean a long way, while the median hardly moves.
Without the 15, the six scores have a mean of 4.5 and a median of 4.5. With it, the mean jumps to 6 but the median only moves to 5. That is why news reports use the median for house prices and incomes.
The mean as a fair share
Children understand the mean best as sharing out. Stack cubes into towers of 4, 8 and 6.
Move cubes from the tallest tower to the shortest until all three are the same height: 6 each. That height is the mean.
This picture also solves missing-value problems. If the mean of four numbers is 5, they add up to 4 × 5 = 20. When three of them are 3, 6 and 7, the fourth must be 20 − 16 = 4.
Dot plots, histograms and box plots
- Dot plots show every value as a dot above a number line. They make the mode and the range easy to see.
- Histograms group values into equal intervals, such as 0–9, 10–19 and 20–29, and show how many fall in each. They suit large data sets.
- Box plots show the median, the quartiles and the smallest and largest values. They are the grade 6 tool for comparing spread.
For bar graphs, pictographs and line plots in earlier grades, see the data and graphs chart. Line plots of measured lengths start with measuring length to the nearest quarter inch.
Where probability fits
Statistics describes data you have collected. Probability predicts what is likely to happen. A fair coin lands on heads with probability 1/2, and a fair dice shows a 6 with probability 1/6.
Grade 7 (7.SP.C) connects the two. Children run an experiment, such as rolling a dice 60 times, and compare the results with what probability predicts. See the probability chart.
Same mean, different spread
Two classes take the same quiz. Class A scores 6, 7, 7, 8 and 7. Class B scores 2, 10, 4, 12 and 7.
Both classes have a mean of 7, so the mean alone says they did equally well.
The range tells a different story. Class A has a range of 8 − 6 = 2, so almost everyone scored about the same. Class B has a range of 12 − 2 = 10, so some children found the quiz easy and others found it hard.
This is the grade 7 idea of comparing two groups by their center and their spread (7.SP.B.3). A center on its own never gives the whole picture.
Statistics projects to try at home
- Bedtime survey: ask ten friends or relatives what time they go to bed. Find the median bedtime.
- Paper planes: throw a paper plane five times and measure each flight. Change one fold and throw five more. Compare the means.
- Supermarket prices: list the price of eight cereals. Is the mean or the median a better “typical price”?
- Dice rolls: roll two dice 30 times and record the totals. Which total is the mode? Is it 7, as probability predicts?
Each project starts with a statistical question, collects real data and ends with a measure that answers the question. That is the whole cycle of statistics.
Good habits with data
- Write the data in order first. Ordering takes ten seconds and prevents most median and range mistakes.
- Count the values. Write “n = 7” beside the list, so the mean divides by the right number and the median uses the right middle.
- Estimate the mean. It must be between the smallest and largest values. A mean of 43 for the books data is clearly the total, not the mean.
- Say what the number means. “The median is 6 books” is better than “6”. Units and context show the answer makes sense.
These habits matter more than speed. A child who orders, counts and checks gets the four measures right almost every time.
What test questions look like
- Find the mean, median, mode and range of a list of 5 to 10 numbers.
- Read the values from a dot plot or a table first, then find the measures.
- Find a missing value when the mean is given.
- Explain which measure best describes the data, often because of an outlier.
- Compare two sets of data using their means and ranges.
The mean, median, mode and range worksheet covers the first four types with an answer key.
Statistics in the Indian syllabus
NCERT starts collecting and showing data in the primary classes and covers mean, median and mode in the middle school data handling chapters. The CBSE class 6 data handling guide has activities for home.
Where kids get stuck
Statistics and probability worksheets
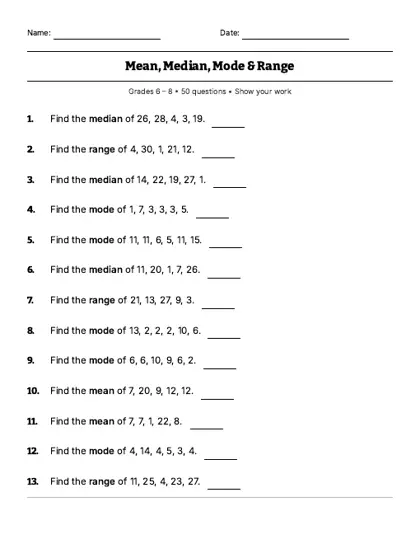 Mean, median, mode and range
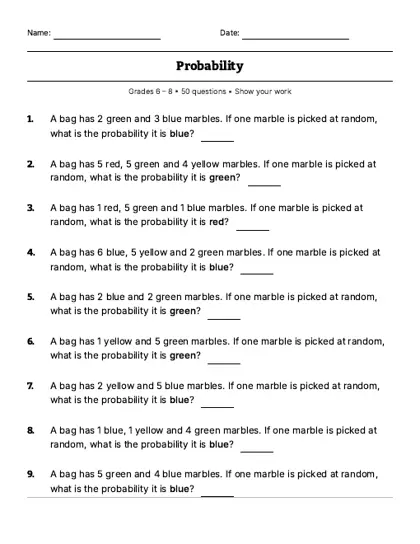 Probability
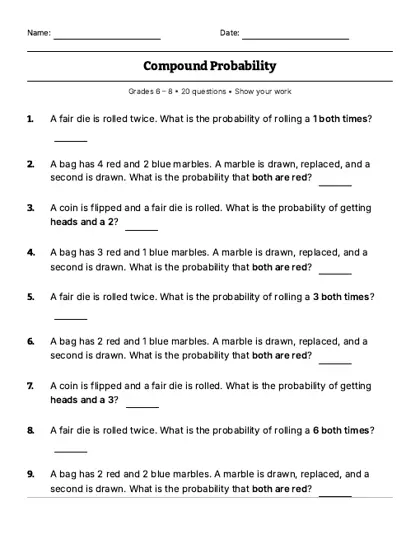 Compound probability
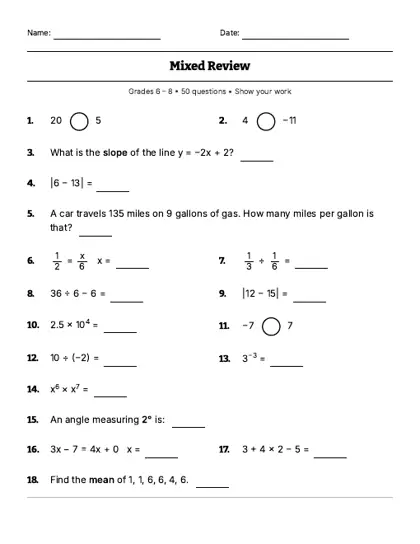 Mixed review, grades 6–8
Make a fresh mean, median, mode and range test · Data and graphs chart · Probability chart
How to teach statistics at home
Track something for a week
Minutes of reading, steps, or the temperature each morning. At the end of the week, find all four measures together.
Use sports scores
Points per game for a favorite player. Is the mean or the median a fairer picture of a typical game?
Measure the family
Heights or shoe sizes of everyone at home. Line people up in height order to find the median in real life.
Last reviewed
Questions parents ask
What is the difference between mean, median, mode and range?
The mean is the average (add and divide), the median is the middle value in order, the mode is the most common value, and the range is the biggest minus the smallest. The first three describe a typical value; the range describes how spread out the data is.
How do you find the median of an even set of numbers?
Put them in order and take the two middle numbers. The median is halfway between them. For 3, 5, 8, 10 the middle pair is 5 and 8, so the median is 6.5.
Can there be more than one mode?
Yes. If two values tie for most common, both are modes. If every value appears once, there is no mode.
When should you use the median instead of the mean?
When there are extreme values. Five houses worth $200,000 and one worth $5 million have a mean far above what most houses cost; the median of $200,000 is more typical.
Is the mean always one of the numbers?
No. The mean of 2, 3 and 6 is 11 ÷ 3 = 3.67, which is not in the list. The median and mode are always values from the data, or halfway between two of them.
What grade learns mean, median and mode?
Grade 6 (6.SP.A.3 and 6.SP.B.5) introduces mean, median, mode and range, along with dot plots, histograms and box plots. Grade 7 uses them to compare two groups.